University of Liège,
Pathology Tower (BC-3), Sart-Tilman, B-4000 Liège, BELGIUM
Phone : +32-4-366.72.75
Fax : +32-4-366.29.36
|
|
University of Liège, Pathology Tower (BC-3), Sart-Tilman, B-4000 Liège, BELGIUM Phone : +32-4-366.72.75 Fax : +32-4-366.29.36 |
Laser photocoagulation.
Choroidal neovascularization is induced in mice by laser burns as previously described. Briefly, mice are anaesthetized with intraperitoneal injection of Avertin. Both pupils are dilated with 1% topical tropicamide, and four burns are delivered (usually at the 6, 9, 12, and 3 o'clock positions around the optic disc) using a green argon laser (532 nm; 50 µm diameter spot size; 0.05 sec duration; 400 mW). Animals are sacrificed after 14 days, eyes enucleated and either fixed in buffered 3.5% formalin solution for routine histology or embedded in Tissue TeK (Miles Laboratories, Naperville, Illinois) and frozen in liquid nitrogen for cryostat sectioning.
a) Systemic treatments :
Mice are injected by IP, IV, or per os. Mice could be injected several time.
b) Ocular treatments:
For these treatments, mice are anaesthetized with intraperitoneal injection of 10 µl of Xylazine 2%, 35 µl of Imalgene 10%, and 155 µl of PBS.
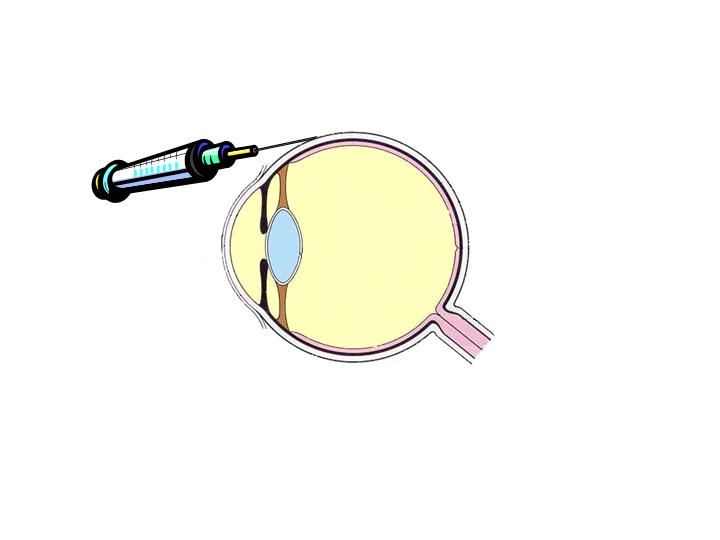
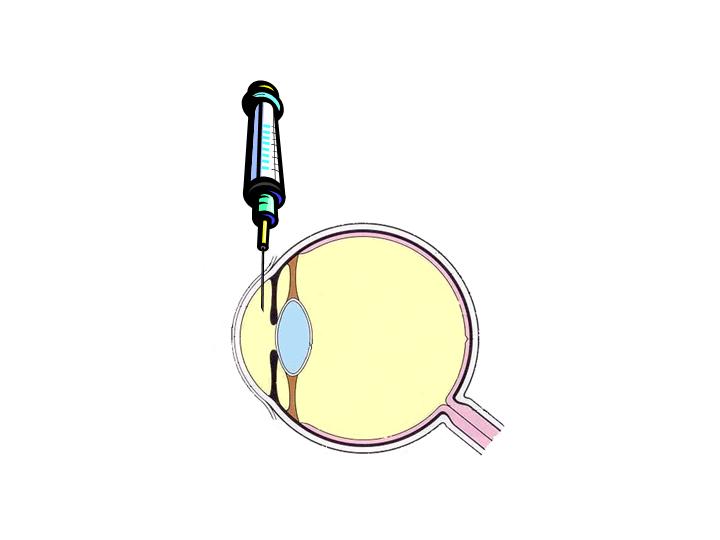
There are different opportunities for the injection site :
1) Materiel et Methods
2) Treatments
3) Quantitation of choroidal neovascularization
4) Confocal imaging
5) Quantification with flat mount choroid
6) Statistic
1) Materiel et Methods
2) Treatments.
![]()
![]()
![]()
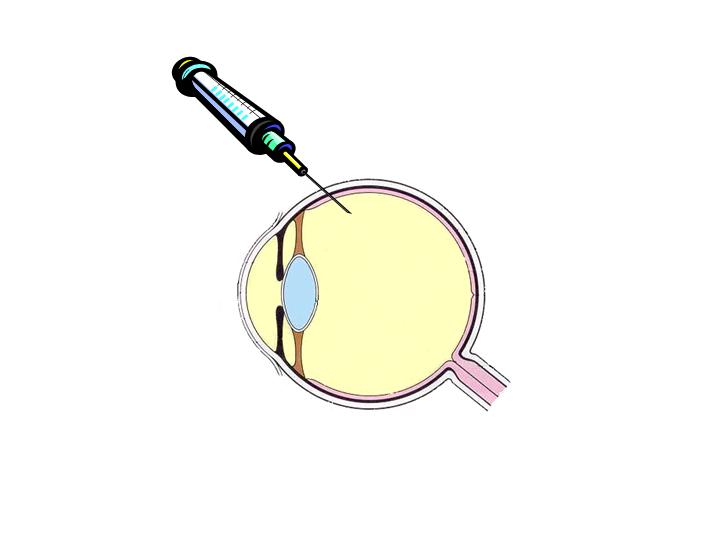 |
limited to viscous solutions or for deposits (one shot).
 |
|
(more complicated) (one shot).
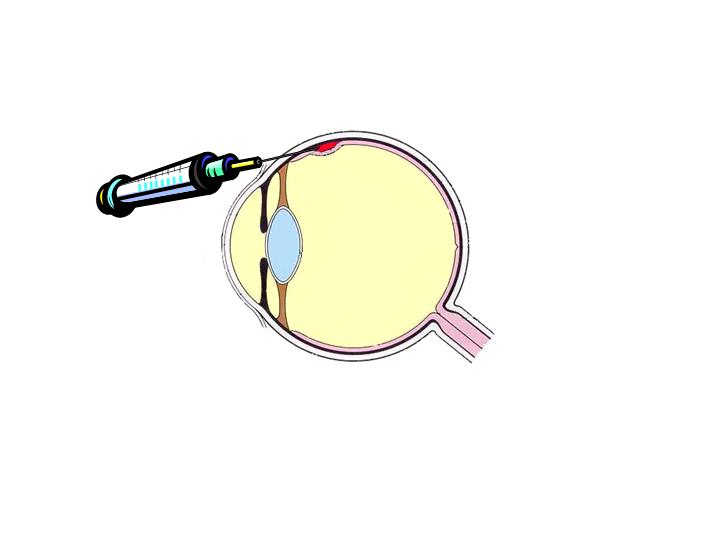 |
(rapid clearance) (one shot).
 |
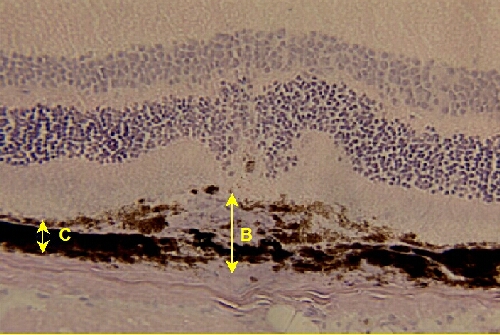
A quantitative morphometric assessment of thickness of choroidal new vessels is carried out using a computer-assisted image analysis system (Olympus Micro Image version 3.0 for Windows 95/NT, Olympus Optical CO. Europe GmBH). Microscopic images (working magnification of x200) of haematoxylin-stained eye section are acquired via a video camera, digitalized and analysed. Frozen serial sections are cut throughout the entire extent of each burn, and the thickest lesions (at least 5 sections per lesion) used for the quantitation studies (96 sections studied). Neovascularization is estimated by the ratio (B/C) of the thickness from the bottom of the pigmented choroidal layer to the top of the neovascular membrane (B) to the thickness of the intact-pigmented choroid adjacent to the lesion (C). The advantage of that method of quantification (over surface estimation) is its independence in relation to oblique sections.
The spatial distribution of FITC fluorescence is examined using a Leica TCS SP2 inverted confocal laser microscope (Leica Microsystems, Germany) equipped with an argon laser and an acousto-optical tunable filter (AOTF) for excitation intensity. Digitized images are acquired using a 10x (NA 0.4) or 63x (NA 1.2) Plan-Apo water-immersion objective at 1024 x 1024 pixel resolution. FITC is visualized using an excitation wavelength of 488 nm and the RSP500 dichroic mirror. The emission light is dispersed and recorded at 500 to 555 nm. For each lesions, serial optical sections are recorded with a z-step of 1.67µm. After successive scanning for each interval, the three-dimensional images of fluorescence can be reconstructed using Leica confocal software. Captured images may be exported as TIFF format files and further processed using Adobe Photoshop. Quantification of the confocal imaging is realized by measurement of the surface of fluorescence (Scion Image for Windows beta 4.0.2).
5) Quantification with flat mount choroid
For confocal visualization, mice are injected intravenously with 200 µl of 50 mg/ml Fluorescein isothiocyanate (FITC)-conjugated dextran (2,000,000 Da avg. molecular weight, Sigma) in phosphate-buffered (pH 7.4). Immediately afterwards, eyes are removed and fixed one hour at room temperature in paraformaldehyde 1% pH 7.4. The retinas are removed and the choroid is mounted flat for confocal microscopy using Vectashield mounting medium (Vector Laboratories, Burlingame, California) to inhibit photo-bleaching.
|
(double click on the image to see the movie) |
(double click on the image to see the movie) |
The measures are realized on the total surface of the vessel's fluorescence. We are currently developing a software to quantify the total volume of the vessels.
All the surface are measured with the Scion Image for Windows beta 4.0.2 software, and the t-student test is used for the statistics with GraphPad Prism 4.0.
At least 5 animals are included in each experimental group, meaning 4 laser impacts per eye, i.e. 8 lesions per animal, with the right eye for the flat mount and the left eye for histology.